

The economic roller coaster of the United States continues with its seamlessly never-ending twists and turns. The Fed has increased interest rates to combat high inflation. Russia sent warning to the west for its involvement in Ukraine.
Recently a report came out in eastern Texas that communities are being encouraged to stop using so much power to avoid possible black outs. The supply chain issue continues to be an issue for the administration. Not to mention student loan payments are set to resume in a couple of months.
These issues are catching the headlines however there are key economic reports that are not talked about as much in mainstream media unless you’re listening to a financial channel. Its important for us to learn some of the key economic reports, so that we won’t get caught off guard when we see a variety of changes in different sectors in our economy. There are a number of reports that are released however we will focus on the key economic reports that impact us young professionals.
What are economic reports?
Economic reports are publications that track and analyze economic indicators. These indicators can include economic growth, inflation, unemployment, and trade balance. Economic reports are released by government agencies and research institutions. They are used to inform policymakers and citizens about the current state of the economy and to forecast future economic conditions. Economic Reports can also be used by businesses and investors to make decisions about economic trends.
What is the annual economic report?
The annual economic report is a document that summarizes the previous year’s economic performance for a given country. It typically includes data on things like gross domestic product (GDP), inflation, unemployment, and trade balance. The annual economic report is used by policymakers to make decisions about the economy. It is also used by businesses and investors to make decisions about where to invest their money.
Where can I find economic data?
There are several places where you can find economic data. The government releases economic data regularly, and there are also private sources that track economic data. You can find economic data online, in newspapers, and in economic journals. Some websites we can find economic data are Yahoo Finance, Bloomberg, U.S. Department of Commerce/Bureau of Economic Analysis, Bureau of Labor Statistics, Economic Research Service, CNBC, Reuters, and Fox Business.
10 Key Economic Reports
Gross Domestic Product (GDP)
Gross Domestic Product (GDP) is an economic report that measures the total value of all goods and services produced in a country during a specific period of time. GDP is one of the most closely watched economic indicators because it provides insight into the overall health of a country’s economy. A high GDP indicates that a country is doing well economically, while a low GDP indicates that the economy is struggling. GDP is also used to compare the economic performance of different countries. Its growth is often used as a measure of a country’s standard of living. GDP per capita is a measure of GDP divided by the population of a country. It is often used to compare the standard of living of different countries.
GDP can be measured in three ways: nominal GDP, real GDP, and GDP per capita. Nominal GDP is the most common way to measure GDP. It is simply the GDP of a country measured in current prices. Real GDP is GDP adjusted for inflation. GDP per capita is GDP divided by the population of a country.
Employment Report:
The Employment Report is one of the most important economic reports released each month. It provides a snapshot of the health of the labor market and can give insights into broader economic trends. The report is closely watched by policymakers, businesses, and consumers. The Employment Report includes data on employment levels, unemployment rates, and other measures of labor market activity. This data can be used to gauge the strength of the economy and to make economic forecasts. The report is released by the Bureau of Labor Statistics (BLS) on the first Friday of every month.
Inflation Report:
The Inflation Report is another important economic report that is released. It provides an insight into the inflationary pressures in the economy and helps policymakers to assess the appropriate monetary policy stance. Inflation has been a key concern for policymakers in recent years, as it can have a major impact on economic growth and stability. The Inflation Report therefore provides a valuable tool for understanding the economic situation and making decisions about future policy.
The report is released every quarter and contains a detailed analysis of inflationary trends. It is closely watched by economic commentators and policymakers, as it can provide valuable insights into the health of the economy.
Consumer Price Index (CPI):
The Consumer Price Index (CPI) is a measure of inflation, which is the rate at which prices for goods and services rise over time. The CPI is important because it can be used to track economic trends and predict future economic conditions. Inflation can have a significant impact on people’s lives, so understanding the CPI can help people make better economic decisions. Inflation is often measured by the Consumer Price Index (CPI), which is a report that tracks the prices of a basket of goods and services over time. The CPI is important because it can be used to track economic trends and predict future economic conditions. Inflation can have a significant impact on people’s lives, so understanding the CPI can help people make better economic decisions.
The CPI measures the prices of a basket of goods and services, which is a representative sample of the items that people purchase. The basket includes items such as food, housing, transportation, and healthcare. The CPI is calculated by taking the weighted average of the prices of all the items in the basket. The weights are based on the relative importance of each item in the overall basket.
Retail Sales Report
The Retail Sales Report is one of the most closely watched economic reports. It provides information on retail sales, which are key drivers of economic growth. The report is released monthly by the U.S. Census Bureau. The Retail Sales Report can be used to gauge consumer spending, which accounts for a large portion of economic activity. The report can also give insights into inflationary pressures.
Why is consumer spending important for our economy?
Well besides the fact that we are currently a capitalistic society. Consumer spending is one of the most important drivers of economic growth. When consumers spend money, it provides a boost to businesses and helps to create jobs. This spending also generates tax revenue which can be used to fund vital public services.
There are several reasons why consumer spending is so important. Firstly, spending provides a source of income for businesses. This income can then be used to pay staff, buy materials, and invest in expansion. Secondly, consumer spending also generates jobs. Businesses need staff to meet customer demand, and this often leads to the creation of new jobs. Finally, consumer spending is a key source of tax revenue. This revenue can be used to fund vital public services, such as healthcare and education.
U.S. International Trade in Goods and Services Report
The U.S. International Trade in Goods and Services Report is a report released by the U.S. Census Bureau that provides data on the country’s international trade in goods and services. The report includes data on exports and imports, as well as information on the balance of trade.
The U.S. International Trade in Goods and Services Report is important because it provides data on the value of goods and services that are traded between the United States and other countries. This data can be used to assess the health of the U.S. economy and to make policy decisions about trade agreements and tariffs. The report is released monthly by the U.S. Census Bureau and the U.S. Bureau of Economic Analysis. The BEA uses the data to update U.S. balance of payments, gross domestic product, and national accounts.
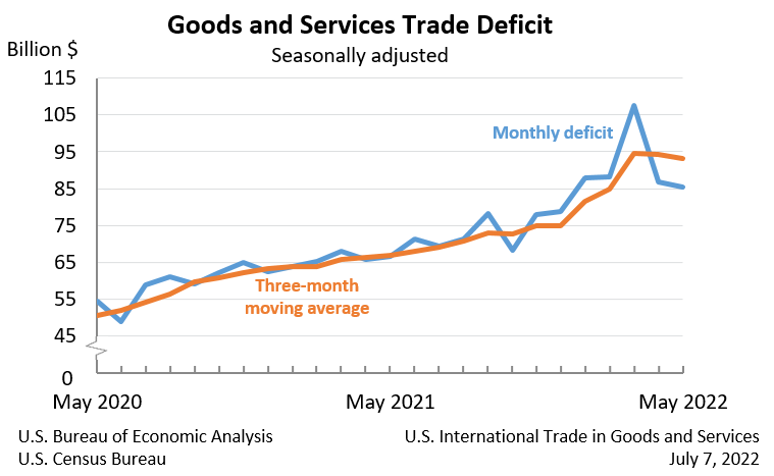
Above is a chart showing the goods and services deficit was $85.5 billion in May, down $1.1 billion from $86.7 billion in April. Exports of goods increased $3.0 billion to $179.0 billion in May. One of the things that I look at from this report is the Goods by Selected Countries and Areas. This shows where the country was in a trade surplus and deficit. According to the May report the May figures show surpluses, in billions of dollars, with South and Central America ($7.1), Netherlands ($2.5), Hong Kong ($2.0), United Kingdom ($1.6), Brazil ($1.5), Singapore ($1.4), Belgium ($1.1), and Australia ($1.0).
Deficits were recorded, in billions of dollars, with China ($32.2), European Union ($17.1), Vietnam ($11.1), Mexico ($9.9), Canada ($9.8), Germany ($6.1), Ireland ($6.0), Japan ($5.9), South Korea ($4.1), Taiwan ($3.9), Italy ($3.8), India ($3.7), Malaysia ($2.9), Switzerland ($1.9), Saudi Arabia ($1.4), France ($0.6), and Israel ($0.4).
See full report: https://www.bea.gov/news/2022/us-international-trade-goods-and-services-may-2022
Manufacturing Activity Report
The Manufacturing Activity Report is a monthly report that measures the level of activity in the manufacturing sector. The report is released by the Institute for Supply Management (ISM), and it surveys hundreds of purchasing managers from across the United States. Manufacturing activity is a leading indicator of economic activity, as manufacturing typically leads other sectors in terms of economic growth. The Manufacturing Activity Report is released on the first business day of each month, and it covers the previous month’s data. The report includes both quantitative and qualitative data, including measures of new orders, production, employment, supplier deliveries, and prices.
The Manufacturing Activity Report is important because it provides insights into the health of the manufacturing sector, which is a key driver of economic growth. The report can also give clues about future inflationary pressures, as increases in manufacturing activity can lead to higher prices for goods and services.
Construction Spending Report
The Construction Spending Report is a report released by the Census Bureau that provides data on spending for private and public construction projects in the United States. The report includes data on the value of new construction projects, as well as information on the type of project (e.g., residential, nonresidential, or public). The Construction Spending Report is released monthly.
Construction spending is an important economic indicator because it can provide information on the health of the overall economy. This type of spending activity can be an early indicator of economic growth, as firms tend to invest in new construction projects when they are confident about future economic conditions. Construction spending can also give insight into inflationary pressures, as the cost of construction inputs can be a leading indicator of inflation.
Non-Farm Payroll:
Non-farm payroll (NFP) is a monthly report released by the Bureau of Labor Statistics (BLS) that details the number of new jobs created in the previous month, excluding farm workers. NFP data is closely watched by economists and policymakers as it offers insights into the overall health of the US economy. NFP numbers can be volatile from month to month, but the long-term trend is generally seen as a good indicator of the economy’s health.
The NFP report is released on the first Friday of every month and is typically one of the most closely watched economic indicators in the US. The report can have a significant impact on financial markets, so it is important for investors to be aware of the release date and time. NFP data is often revised in the following months, so it is important to keep an eye on these revisions as well.
Initial Jobless Claims:
Initial Jobless Claims report is a weekly report released by the US Department of Labor that tracks the number of individuals that have filed for unemployment benefits in the previous week. The report is closely watched by economists and market analysts as it provides insights into the health of the US labor market. Initial claims are typically seen as an indicator of future economic activity, as higher claims levels typically coincide with slower economic growth.
The Initial Jobless Claims report is released every Thursday morning at 8:30am ET. The report covers the previous weeks’ worth of data and is released on a seasonally adjusted basis. Initial claims data is gathered from state unemployment offices and compiled by the US Department of Labor.
Conclusion:
If this is your first time learning about these key economic reports, it can seem like a lot of information to digest. The goal is to get a general understanding about what these different indicators are so that when they are mentioned by the president or in November during the mid-terms, we have an idea of what they are talking about. Some of the financial terms that have been frequently mentioned lately are GDP growth, unemployment rates, recession, inflation, and CPI. We hope you found this article helpful. Please feel free to share it with your family and friends. Are there any other economic reports you review to see the current health of our economy? If so let us know down below! Be sure to check out my other blog 10 Financial Terms Young Professionals Should Know: Part 1